
Last updated: 13 August 2026. Market figures are refreshed quarterly.
Key stablecoin statistics for 2026 (the short version)
- The total stablecoin market capitalisation is $308.0 billion as of 13 August 2026, up 14.3% year over year and ~99.5% dollar-denominated, though 4.5% below its May 2026 peak. (DefiLlama; BIS)
- Tether (USDT) holds ~59% of stablecoin supply but ~74% of on-chain trading volume, while USDC leads by annual transaction volume at $18.3T vs USDT's $13.3T in 2025. (CoinDesk Data; Artemis, via Bloomberg)
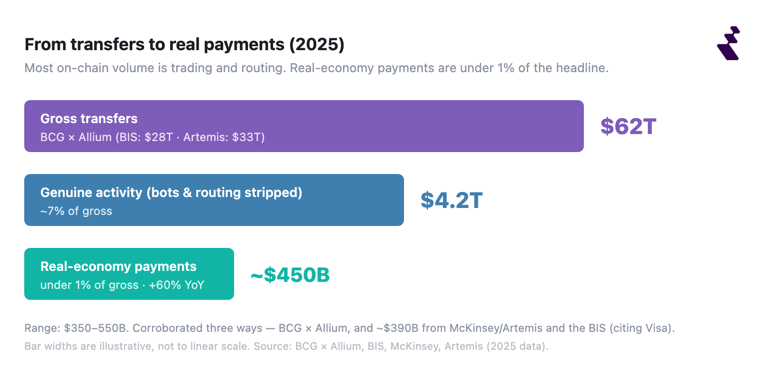
- Of the $28–62 trillion in stablecoin transfers in 2025, only about $350–550 billion was genuine real-economy payments — the rest is trading and moving funds between wallets and exchanges. (BIS; BCG × Allium; McKinsey)
- The US GENIUS Act wiped an estimated ~$300 billion (about 18%) off the market value of incumbent payment firms, with cross-border firms hit hardest. (IMF, 2026)
- Among businesses that have used stablecoins, 41% report cost savings of 10% or more, mostly on cross-border payments, though adoption is still early.
- Stablecoins settled $7.2 trillion in February 2026, surpassing the US ACH network for the first time.
- Asia is the largest stablecoin-flow region at $12.5 trillion in 2025 (+67% year over year), and the majority of flows occur outside the US.
- Stablecoin issuers are now regulated under dedicated law in the US, EU and Hong Kong, and every major regime bans paying interest to holders.
- Cross-border B2B stablecoin payments are projected to reach $5 trillion by 2035, from ~$13.4 billion in 2026, with ~85% of stablecoin value coming from B2B.
Stablecoins crossed from a crypto-trading instrument into payments infrastructure in 2026. Supply sits above $300 billion, financial markets are pricing in hundreds of billions of disruption to incumbent payment firms, and three of the world's largest economies now license issuers under dedicated law. But there is a wide gap between how much stablecoin value moves and how much of it is real payments — and reading that gap correctly is the most important thing about stablecoin data. This page collects the numbers that matter, each one sourced and dated.
A note on our data. Most stats aggregate public, on-chain and independent sources (DefiLlama, Artemis, CoinDesk Data, rwa.xyz) and named research and authorities (BIS, IMF, ECB, BCG, McKinsey, Juniper, World Bank). Business-adoption figures come from an independent 2025 EY-Parthenon survey and are labelled as such. Where a figure needs noise-filtering — like "how much is actually payments" — we show a range across sources and name the method.
Stablecoin market snapshot (as of 13 August 2026)
- Total stablecoin market capitalisation: $308.0 billion
- Change over 30 days: −$3.23 billion (−1.04%)
- Change over 90 days: −$13.79 billion (−4.28%)
- Change year to date: flat
- Change over 12 months: +$38.59 billion (+14.3%)
- All-time peak: $322.4 billion on 17 May 2026
- Largest stablecoin: USDT, 59.1% of supply
- Largest chain: Ethereum, 48.7% of supply
Source: DefiLlama aggregate stablecoin supply series, retrieved 13 August 2026.
1. Stablecoin market size and growth
- The total stablecoin market capitalisation reached $308.0 billion as of 13 August 2026. (DefiLlama)
- Stablecoin supply grew 14.3% year over year, from $269.4 billion in August 2025 to $308.0 billion in August 2026. (DefiLlama)
- Stablecoin supply has decoupled from the crypto price cycle: it fell more than 30% in the last bear market but has held near record highs through the 2026 downturn.
- An estimated ~269 million on-chain addresses hold a stablecoin balance as of mid-2026 via rwa.xyz.
- Stablecoins now make up ~13% of the entire crypto market by capitalisation.
2. Market concentration: supply vs trading volume
- By supply, Tether (USDT) leads at ~59% of all stablecoin supply and USD Coin (USDC) is second at ~23%, together ~82% of the market. (DefiLlama, Aug 2026)
- USDT accounts for ~74% of stablecoin trading volume on centralised exchanges — even higher than its supply share.
- USDC overtook USDT by annual (adjusted) transaction volume in 2025, processing $18.3 trillion to USDT's $13.3 trillion (of a ~$33 trillion total, +72% YoY), even though USDT still leads by supply. (Artemis, via Bloomberg)
- Beyond the top two, the largest stablecoins by share of supply are Sky Dollar (USDS) ~2.1%, DAI ~1.5%, World Liberty Financial USD (USD1) ~1.3% and Ethena USDe ~1.3%, followed by institution-backed dollars including Circle USYC (~1.0%), BlackRock BUIDL, PayPal USD (~0.9%), Global Dollar (USDG) at ~1.1% and Ripple USD (RLUSD) at ~0.5%. (DefiLlama, Aug 2026)
3. Which blockchains carry stablecoins
- Ethereum carries the most stablecoin supply at roughly 49% and Tron is second at roughly 31%, together about 79% of all supply. (DefiLlama, Aug 2026)
- After Ethereum and Tron, the next-largest chains for stablecoin supply are Solana (~5%), BNB Chain (~4%), Hyperliquid (~2%), Base, Arbitrum and Polygon (~1% each). (DefiLlama, Aug 2026)
- For real-economy payments specifically, TRON carries 60–80% of flows, though its share fell from ~74% (Jan 2025) to ~60% (end 2025) as regulated volume moved to Ethereum, Solana, BNB Chain and Polygon.
4. Transaction volume: the truth behind the numbers
Raw on-chain volume is dominated by bots, trading and internal routing, so headline "trillions" massively overstate payments. Independent teams that filter the noise converge on one point: real payments are a few hundred billion dollars, not trillions.
- Gross stablecoin transfers in 2025 are estimated at ~$28 trillion (BIS), ~$33 trillion (Artemis) and more than $62 trillion (BCG × Allium), with the spread reflecting different inclusion rules.
- BCG's analysis finds only ~7% of stablecoin transfer volume ($4.2 trillion of $62 trillion in 2025) is genuine economic activity; the rest is trading, bots and internal routing. (BCG × Allium, 2025)
- Real-economy stablecoin payments for goods and services reached ~$350–550 billion in 2025, up ~60% year over year.
- Three independent studies converge on a few hundred billion in real stablecoin payments in 2025: $350–550 billion (BCG) and ~$390 billion (McKinsey/Artemis; BIS citing Visa) — under 1% of total transfer volume.
- Stablecoins settled $7.2 trillion in February 2026, surpassing the ACH network ($6.8 trillion) for the first time, then $7.5 trillion in March.
- Stablecoin volume estimates diverge because blockchains record how value moves, not why — economic intent has to be inferred. (BCG × Allium; BIS, 2026)
5. Stablecoin net inflows and outflows
Net stablecoin flows measure the change in total circulating supply: new tokens minted minus tokens redeemed. Rising supply means capital entering the stablecoin system; falling supply means capital leaving it. Flows are read as a liquidity signal because stablecoins are the main settlement asset on most crypto venues.
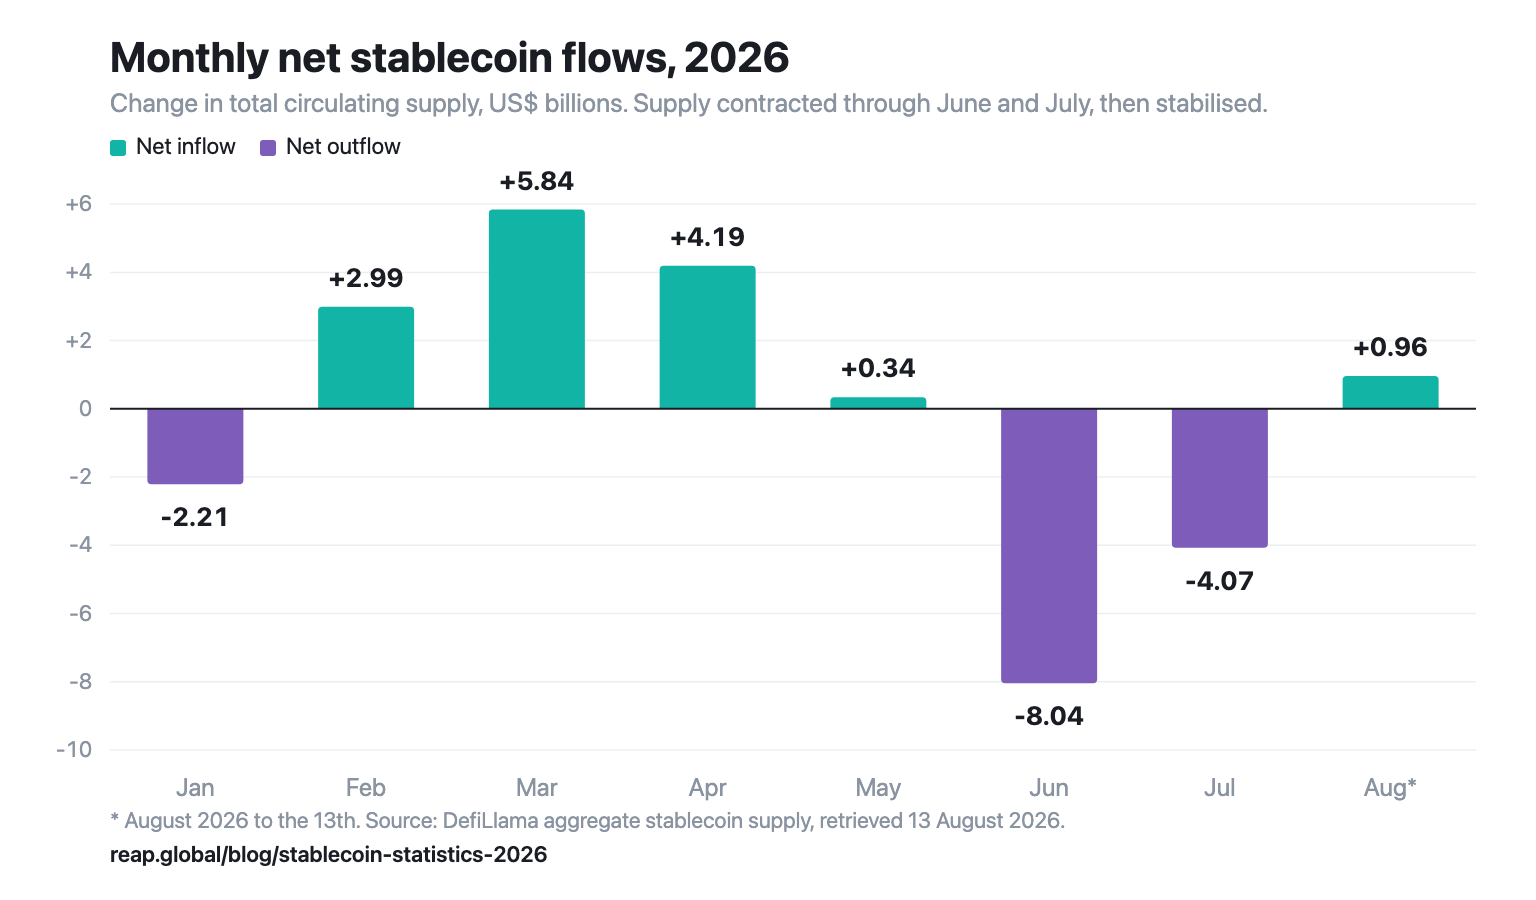
- Stablecoin supply contracted through June and July 2026, then stabilised in August. Supply peaked at $322.4 billion on 17 May 2026 and stood at $308.0 billion on 13 August 2026, 4.5% below that peak. (DefiLlama, Aug 2026)
- Net flows over the periods to 13 August 2026: −$3.23 billion over 30 days (−1.04%), −$13.79 billion over 90 days (−4.28%), flat year to date, and +$38.59 billion (+14.3%) over twelve months. (DefiLlama, Aug 2026)
- Monthly net flows across 2026: January −$2.21B, February +$2.99B, March +$5.84B, April +$4.19B, May +$0.34B, June −$8.04B, July −$4.07B, and +$0.96B in August to the 13th. June was the heaviest outflow month of the year. (DefiLlama, Aug 2026)
- Supply is still up 14.3% over twelve months, so the mid-year contraction reads as a pullback from a peak rather than a reversal of the growth trend.
The headline masks a rotation. Aggregate flows are not uniform across issuers.
- Over the 30 days to 13 August 2026, Global Dollar (USDG) grew fastest among the ten largest stablecoins at +17.2%, while World Liberty Financial USD (USD1) fell hardest at −9.0%. (DefiLlama, Aug 2026)
- The two largest stablecoins both shrank modestly over the same period: USDT −0.7% and USDC −1.2%. (DefiLlama, Aug 2026)
Stablecoin Supply Ratio (SSR)
The Stablecoin Supply Ratio compares Bitcoin's market capitalisation to total stablecoin supply. A lower ratio means more stablecoin buying power relative to the size of the Bitcoin market, which traders read as latent demand.
- SSR stood at approximately 4.16 as of 13 August 2026, derived from Bitcoin's market capitalisation of ~$1,281.7 billion (CoinGecko, Aug 2026) against total stablecoin supply of $308.0 billion (DefiLlama, Aug 2026). This is a derived ratio, not a figure lifted from a single source.
6. Card spending and cross-border cost
- Stablecoin-linked (crypto) card spending reached ~$18 billion annualized in late 2025/early 2026, rivaling P2P transfers (~$19 billion), after compounding ~106% a year since January 2023.
- Visa reported a $3.5 billion annualized stablecoin (USDC) settlement volume as of November 2025. (Visa)
- Cross-border remittances still cost 6.49% globally on average (Q1 2025), well above the G20's 3% target — while stablecoin transfers run ~40% cheaper than traditional channels once total costs are included. (World Bank; BVNK)
7. Who's actually using stablecoins (business adoption)
(Figures below are from an independent 2025 EY-Parthenon survey of 350 corporate and financial-institution decision-makers.)
- ~13% of organisations have used stablecoins (23% of financial institutions, 8% of corporates), and 54% of non-users expect to start within 6–12 months.
- 41% of businesses that have used stablecoins report cost savings of 10% or more, driven mainly by cross-border payments.
- The top reasons businesses adopt stablecoins are lower transaction costs (52%) and faster cross-border payments (45%), and the leading use cases are paying suppliers cross-border (62%) and accepting cross-border payments (53%).
- 87% of corporates believe stablecoin adoption could be a competitive advantage.
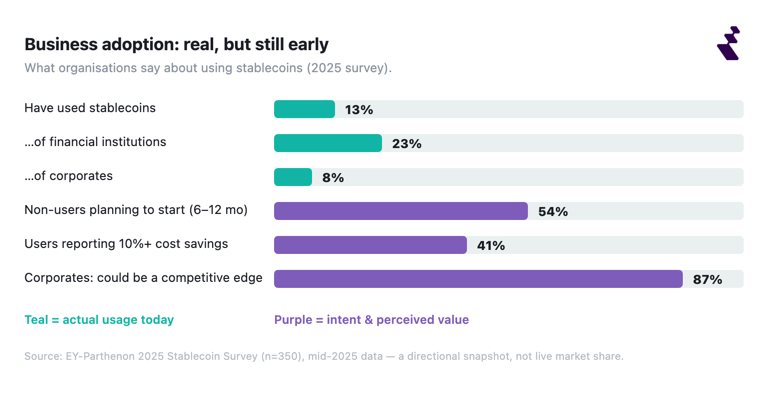
Note: these are mid-2025 survey figures (pre-GENIUS-signing) — a directional adoption snapshot, not live market share.
8. What actually backs a stablecoin
- Stablecoin reserves vary sharply by issuer. Tether reported approximately $141 billion of direct and indirect US Treasury bill exposure as of 31 March 2026 (Tether Q1 2026 attestation, prepared by BDO), USDC holds roughly one-third in Treasuries with the rest in overnight repo and cash (Circle), and Gemini's GUSD is backed 100% by bank deposits (Gemini, May 2026 attestation).
- Tether states that its Treasury exposure makes it the 17th largest holder of US Treasuries globally. (Tether Q1 2026 attestation)
- Tether's excess reserves roughly halved across the first half of 2026. Total assets were $191.77 billion against $183.54 billion of liabilities at 31 March 2026, leaving $8.23 billion in excess reserves; by 30 June 2026, total assets were $187.75 billion against $183.64 billion of liabilities, leaving $4.11 billion. (Tether Q1 and Q2 2026 attestations, prepared by BDO)
- Circle holds USDC reserves through the Circle Reserve Fund, an SEC-registered 2a-7 government money market fund managed by BlackRock and custodied at BNY Mellon, holding cash, short-dated US Treasuries and overnight Treasury repurchase agreements, alongside bank deposits. Circle publishes monthly third-party attestations and names Deloitte & Touche LLP as its independent auditor. (Circle)
- Stablecoin issuers' Treasury-bill holdings now rival those of large countries — collectively a top-20 foreign holder of short-term US Treasuries, with Tether around 17th. (US Treasury Dept via ECB; Tiger Research, 2026)
- Tokenized Treasury products are separately visible on-chain: Circle USYC held ~$3.0 billion and BlackRock BUIDL ~$2.7 billion. (DefiLlama, Aug 2026)
- Under the US GENIUS Act, stablecoin reserves must be one-to-one in cash and short-term US Treasuries with monthly audited disclosures, and comparable full-reserve rules now apply in the EU, UK, Hong Kong, Singapore, Japan and the UAE.
9. Stability and depegs
- In March 2026, the stablecoin ResolvUSD (USR) was exploited for ~$80 million and depegged to as low as $0.14, before its market cap fell 55.9% to ~$49 million.
- Regulators note that today's stablecoins often behave more like exchange-traded-fund shares than a true means of payment, with occasional deviations from par and redemption frictions.
10. What the market thinks: the $300 billion repricing
The following in this segment are insights from International Monetary Fund's Stablecoins and the Future of Payments: Evidence from Financial Markets.
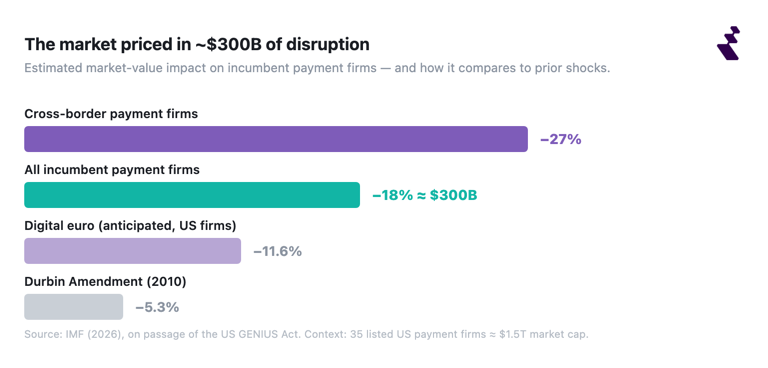
- When the US passed the GENIUS Act (its stablecoin law), the stock market cut the value of listed incumbent payment firms by an estimated ~18%, or roughly $300 billion — a market verdict that stablecoins are a real competitive threat.
- That GENIUS Act repricing hit cross-border payment firms hardest (down ~27%), while card networks and crypto-engaged firms were largely insulated.
- The GENIUS Act's ~$300 billion hit to payment-firm value was larger than past regulatory shocks such as the Durbin Amendment (5.3%) or an anticipated digital euro (11.6% for US firms).
- For scale, the 35 listed US payment firms affected were worth a combined ~$1.5 trillion in 2024 — about 77% of the market cap of all listed US commercial banks.
11. Tokenized real-world assets (RWA)
- Total tokenized real-world assets on-chain reached ~$25 billion (DefiLlama) to ~$29–31 billion (rwa.xyz) as of mid-2026, depending on inclusion rules. (DefiLlama; rwa.xyz, Jun 2026)
- Tokenized assets break down roughly 50–55% US Treasuries, ~34% commodities and ~7% stocks/equities. (CoinDesk Data, Mar 2026)
- The on-chain RWA holder base reached ~949,000 asset holders, up ~13% in 30 days. (rwa.xyz, Jun 2026)
12. Tokenized US Treasuries
- Tokenized US Treasuries reached ~$12–15 billion in 2026, up from ~$8.9 billion at the start of the year.
- The two largest tokenized-Treasury funds are Circle USYC and BlackRock BUIDL (each ~$2.4–3.0 billion), with USYC overtaking BUIDL for the top spot in early 2026.
13. Tokenized commodities and equities
- Tokenized gold reached ~$3.2 billion for Tether Gold (XAUt) and ~$2.3 billion for Paxos Gold (PAXG) in early 2026.
- Tokenized equities are small but fast-growing at ~$1.1 billion (up ~46% in March 2026, ~7% of all tokenized assets), led by xStocks.
14. Currency denomination: the dollar's grip
- Around 99% of all fiat-backed stablecoin supply is US-dollar-denominated (the BIS puts it at 99.4%; DefiLlama showed 99.5% in August 2026).
- Non-dollar stablecoins reached an all-time high of only ~$2 billion in circulation, up ~42% in 2026 — a rounding error next to the dollar market.
- Euro stablecoins total ~€450–500 million, with MiCA-authorised issuers including EURC (Circle), EURCV (Société Générale Forge) and EURI (Banking Circle). (ECB, 2026)
15. Asia and the regional stablecoin landscape
- Asia is the largest stablecoin-flow region at $12.5 trillion in 2025, up 67% year over year — more than any other region. (CoinDesk Global Digital Asset Adoption Index, 2026)
- Latin America is the fastest-growing region for real-world stablecoin usage, driven by inflation-hedging and remittances, and the majority of global stablecoin flows occur outside the US. (Chainalysis; CoinDesk Data; Cambridge CAF)
- Asian stablecoin regulation varies by market: Hong Kong's Ordinance took effect Aug 2025 (36 licence applications pending as of Feb 2026; first issuer licences granted April 2026), Singapore's framework is live with 6–8 issuers, Japan legislated first (JPYC launched Oct 2025), South Korea has passed a framework but no dedicated stablecoin law, and China maintains a full private ban. (Tiger Research, Feb 2026)
- Singapore and Hong Kong face lower bank-disintermediation risk from stablecoins than the US. (DBS, 2026)
16. Stablecoins vs tokenised deposits vs CBDCs
Three forms of "digital money" are emerging, differing on who issues them, what claim you hold, and how they redeem:
- Stablecoins — blockchain tokens backed ~1:1 by reserves, freely transferable on public chains.
- Tokenised deposits — a claim on a commercial bank (e.g. JPMorgan), redeemable at par for central-bank money.
- CBDCs — central-bank-issued digital money (e.g. China's e-CNY).
(Deutsche Bank Research, 2026)
17. Stablecoin regulation in 2026
- United States — GENIUS Act: signed 18 July 2025, with the full regime expected operational by January 2027.
- European Union — MiCA: stablecoin rules have applied since 30 June 2024, with a growing list of authorised issuers and stablecoins (USDC, EURC, EURCV and others); the transition period for legacy issuers ends 1 July 2026.
- Hong Kong — Stablecoins Ordinance: effective 1 August 2025, with the first two issuer licences granted 10 April 2026.
18. The outlook: stablecoins as payments infrastructure
- Cross-border B2B stablecoin payments are projected to reach $5 trillion by 2035, up from ~$13.4 billion in 2026, with ~85% of stablecoin value coming from B2B.
- Financial institutions expect 5–10% of global payments to run on stablecoins by 2030 (~$2.1–4.2 trillion).
- Today's B2B stablecoin payment base is ~$226 billion a year (McKinsey), and Citi projects the total stablecoin market at $2–4 trillion by 2030.
- Incumbents are building stablecoin rails too: Visa, Mastercard, Stripe and Coinbase are backing a new stablecoin platform, and Japan's three megabanks plan a joint yen stablecoin by 2027. (2026)
FAQ
How big is the stablecoin market in 2026?
The total stablecoin market capitalisation is $308.0 billion as of 13 August 2026, up 14.3% year over year according to DefiLlama, and 4.5% below its all-time peak of $322.4 billion set on 17 May 2026. About 99.5% of that supply is denominated in US dollars, and Tether and USD Coin together account for roughly 82% of the market.
Are stablecoin flows positive or negative right now?
Stablecoin supply contracted through June and July 2026 and stabilised in August. Supply fell 1.04% over the 30 days to 13 August 2026 and 4.28% over 90 days, per DefiLlama, but is still up 14.3% over twelve months. June was the heaviest outflow month of the year at −$8.04 billion.
How much US Treasury debt do stablecoin issuers hold?
Tether alone reported approximately $141 billion of direct and indirect US Treasury bill exposure as of 31 March 2026, and states this ranks it as the 17th largest holder of US Treasuries globally. Collectively, stablecoin issuers are a top-20 foreign holder of short-term US Treasuries.
How much of stablecoin volume is actually payments?
Very little. Of the $28–62 trillion in gross stablecoin transfers in 2025, independent studies from BCG, McKinsey and the BIS estimate only about $350–550 billion was genuine real-economy payment activity. Most on-chain volume is trading, protocol activity and moving funds between wallets and exchanges.
Which stablecoins are the largest?
By supply, Tether (USDT) leads at about 59% of all stablecoin supply and USD Coin (USDC) at roughly 23%, together about 82% of the market. USDC has overtaken USDT by annual transaction volume, at $18.3 trillion versus $13.3 trillion in 2025, so the ranking flips depending on whether you measure supply or usage.
Where are stablecoins used most?
Asia is the largest stablecoin-flow region, handling about $12.5 trillion in 2025, up 67% year over year according to CoinDesk Data. Latin America is the fastest-growing region, and the majority of stablecoin flows occur outside the United States despite the dollar's dominance.
Are stablecoins regulated?
Yes, increasingly. As of 2026 the United States (GENIUS Act), the European Union (MiCA) and Hong Kong all license stablecoin issuers under dedicated law, with comparable frameworks in the UK, Singapore, Japan and the UAE. These regimes converge on full reserve backing, redemption at par value, and a ban on paying interest to holders.
Disclaimer
The information provided in this material is for general informational purposes only and does not constitute legal, financial, tax, or business advice. It should not be interpreted as a recommendation, offer, solicitation, or inducement to engage with Reap's products or services. Any use of Reap's services is at the user's sole risk and discretion.
Reap makes no representation or warranty, express or implied, regarding the accuracy, completeness, or reliability of the information provided. Services are governed exclusively by Reap's applicable legal agreements. Service availability, features, and eligibility may vary by jurisdiction and are subject to regulatory, card network, and operational limitations.
All trademarks, logos, and brand names are the property of Reap and/or their respective owners. References to third-party platforms or services are for descriptive purposes only and do not imply endorsement, partnership, or affiliation.
Reap's services and information are provided on an "as is" and "as available" basis, without warranties of any kind. Reap shall not be liable for any loss or damage arising from the use of, or reliance on, this information or its services.


